


 +91 97866 99000
 (720) 500-3435
 +4915168619030

GA4: The Next Generation of Analytics for Modern Marketers
GA4: The Next Generation of Analytics for Modern Marketers
Google Analytics 4 (GA4) is the latest and greatest version of Google’s analytics platform. It gives marketers even better tools to understand their website traffic. With GA4, you can closely watch how users behave on your site and also enable the marketers to monitor user behavior more closely than ever.
From tracing customer journeys to uncovering data insights through exploration reports, and discovering important user groups along with lifetime value analysis – GA4 brings value to all.
In this blog, you’ll discover how to smoothly switch from Universal Analytics (UA) to GA4. We’ll explain the differences between the two and guide you through the migration process. Additionally, we’ll help you explore the reporting features in GA4. By the time you finish reading, you’ll have a clear understanding of GA4 and be ready to use it for smarter marketing choices based on your data.
Google Universal Analytics (UA) was replaced by Google Analytics 4 (GA4)
GA4 emerged as the latest iteration of Google’s robust analytics tool, superseding Universal Analytics.
Starting from July 1, 2023, regular Universal Analytics properties ceased processing data. Nonetheless, 360 Universal Analytics properties with an existing 360 order (for either Google Analytics 4 or Universal Analytics) enjoyed extended processing time until July 1, 2024.
Between March 2023 and July 1, 2023, Universal Analytics users could still gather new data. However, following this period, access was limited to data processed earlier, spanning six months. Subsequently, all Universal Analytics properties became inaccessible.
Marketers were strongly advised to transition to Google Analytics 4 at their earliest convenience. This facilitated the accumulation of historical data and familiarity with the new system before Universal Analytics ceased to be available.
Differences: Universal Analytics (UA) vs Google Analytics 4 (GA4)
Event-based Tracking: Universal Analytics (UA) primarily tracked page views and sessions, whereas Google Analytics 4 (GA4) revolves around tracking events. GA4 classifies events into 4 types: automatically collected, enhanced measurement, recommended, and custom. The first two are tracked automatically, while the latter two require a custom setup.
Views Replaced by Data Streams: In Google Analytics 4, the concept of “Views” has been replaced. Instead, GA4 employs “Data Streams” within its account hierarchy. It’s important to note that Data Streams serve a different purpose than Views did previously. They can be analyzed separately or aggregated.
User Tracking and Sessions: In Universal Analytics (UA), cookies were used to identify and track user interactions. In contrast, Google Analytics 4 (GA4) utilizes machine learning and device identification to establish these connections.
Session Discrepancy from UA: The dissimilarity in session calculations results in non-alignment. In GA4, the closest approximation is achieved by counting the session_start event.
Custom Reporting: GA4 offers fewer pre-set reports compared to UA, requiring a period of adjustment. However, the available reports can be customized to meet various needs. The reporting structure has been entirely revamped in GA4, employing the “Analysis Hub” for navigation. Exploration Reports now take the place of the older Custom Reports in UA, providing adaptable visualization customization.
Enhanced Cohort and Lifetime Insights: GA4 introduces a cohort analysis tool that assists marketers in uncovering trends in user behavior over time, making it easier to pinpoint effective strategies. Additionally, Google Analytics 4 (GA4) offers prediction models that provide marketers with visibility into the likelihood of customer conversions.
Goals Change in GA4: Unlike in Universal Analytics (UA), goals are no more in GA4. Instead, you need to label an event as a “conversion.” Furthermore, automatic goals like pages per session and session duration are absent in GA4.
Setting Up Google Analytics 4 (GA4)
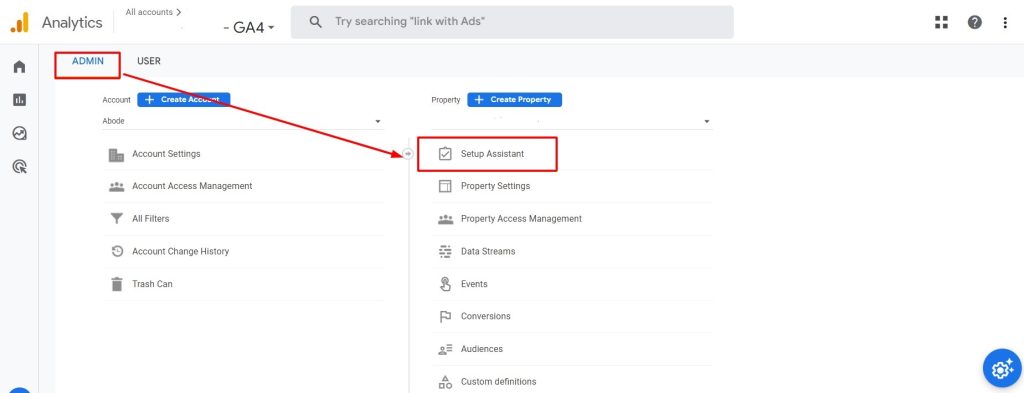
Creating a GA4 Property Alongside UA Using Setup Assistant

Installing GA4 Tag for Optimal Performance
The installation process for your GA4 tag depends on your hosting setup. You have various options:
- Manual Installation: Install the tag code manually on your website.
- Google Tag (gtag.js) Integration: Add the tag through an existing Google tag.
- CMS or Website Builder Integration: Utilize tools like Shopify, WordPress, Wix, etc.
- Tag Manager Implementation: Employ platforms like Google Tag Manager, Tealium, Segment, etc.
Once the tag is in place, verify data collection using the Realtime report. For optimal GA4 results, ensure that all standard and recommended events are firing. Some CMS platforms might include these by default, but we suggest using a clean and precise data layer through your tag manager for a comprehensive implementation.
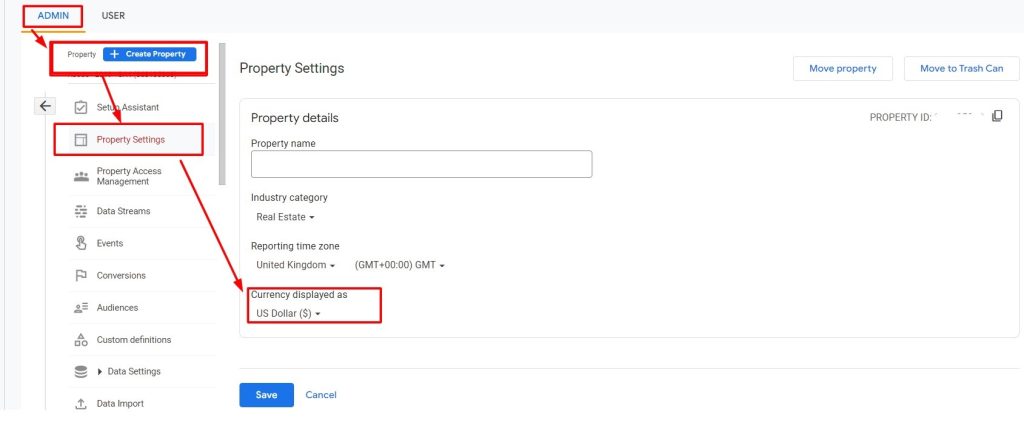
Basic Admin Configuration for GA4
After establishing the basic tag and events, it’s important to configure the following admin aspects (at the least):
Basic Settings: Set parameters like time zone, currency, and default attribution settings.
Data Retention: Define how long you want to retain your data for analysis.
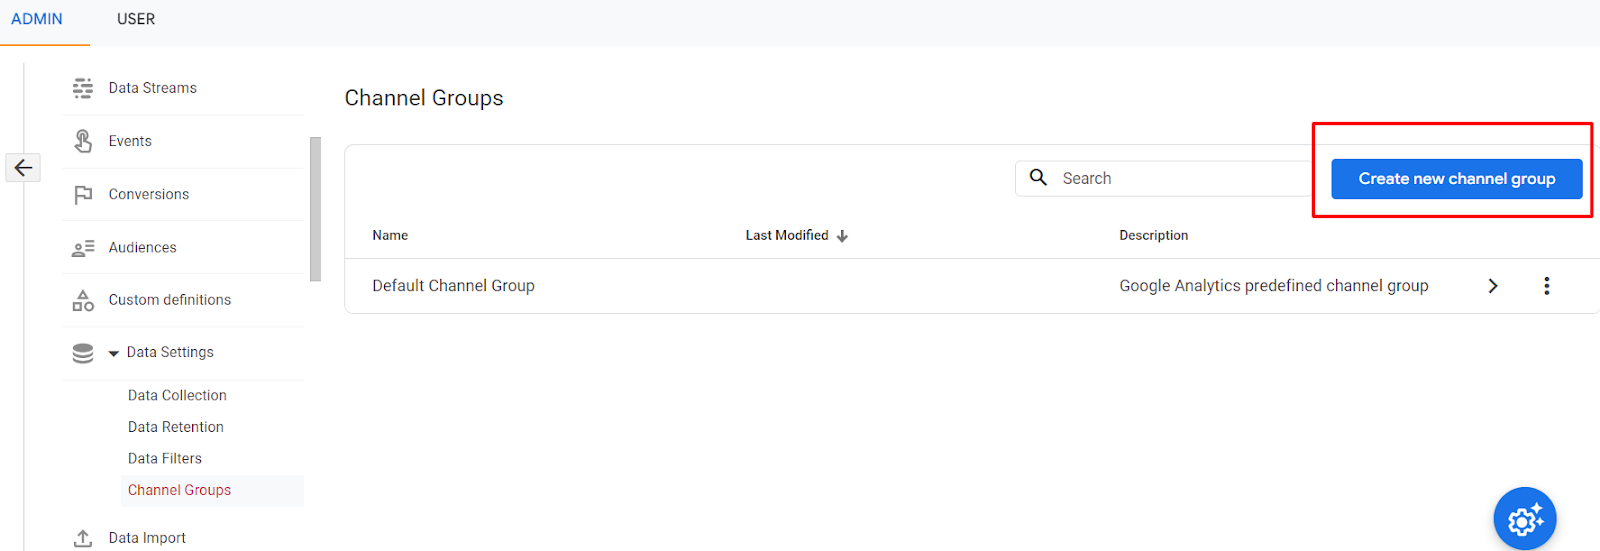
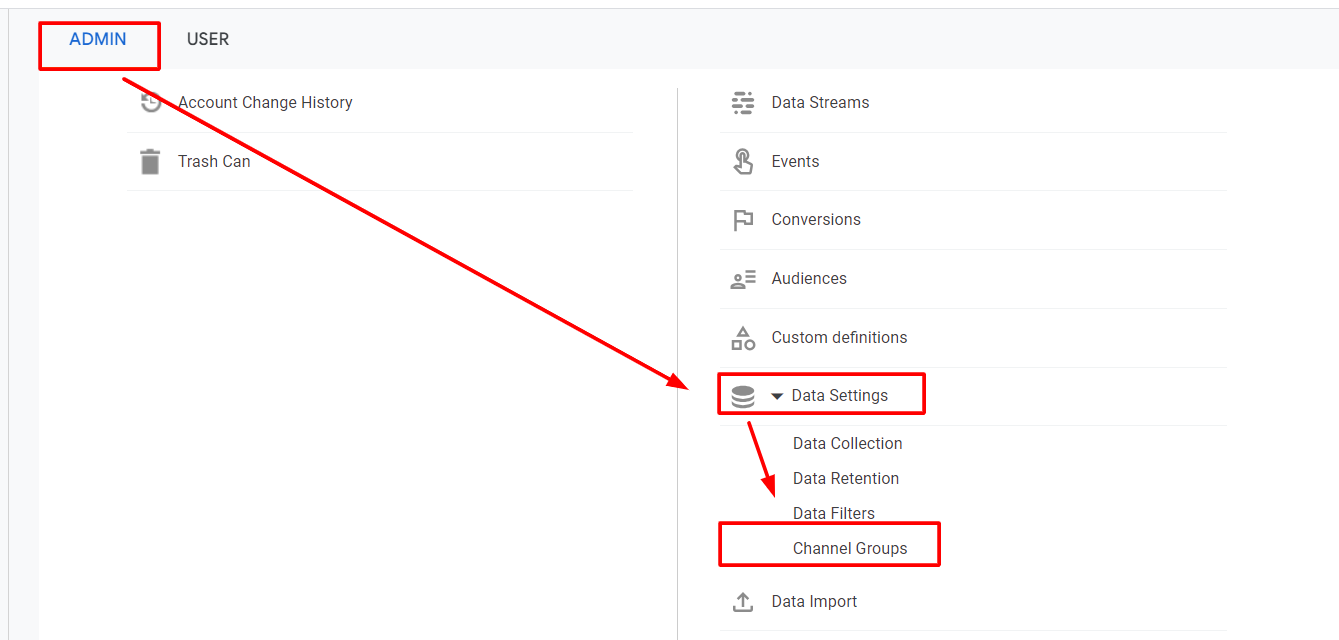
Customize Channel Groupings in GA4

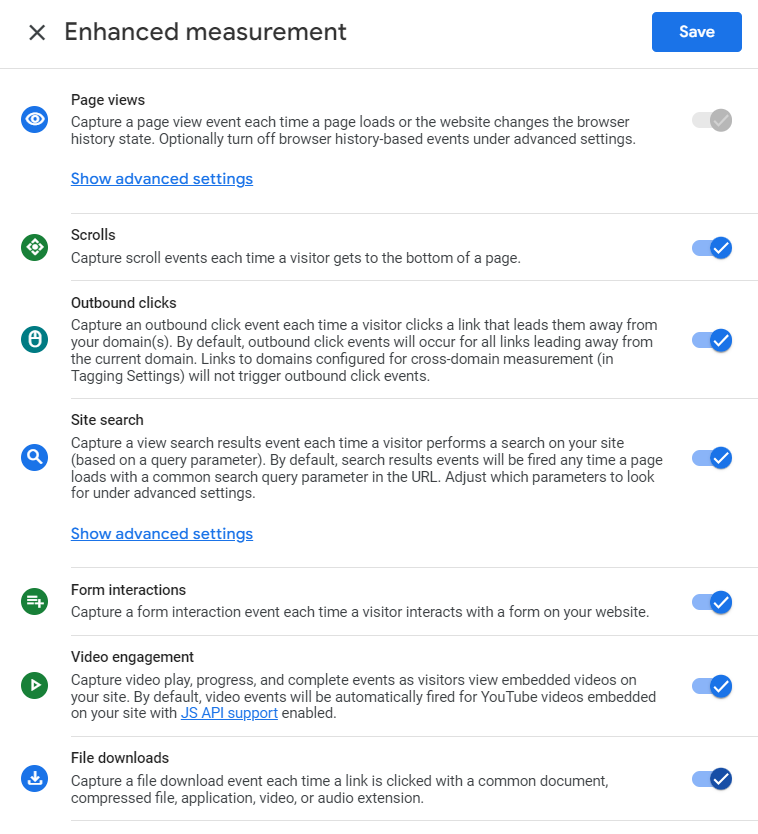
Activating Enhanced and Recommended Events in GA4
Navigate: Admin > Property > Data Streams (Choose Stream) > Enhanced Measurement Settings

Exploring GA4’s Reporting Interface: Beyond UA Differences
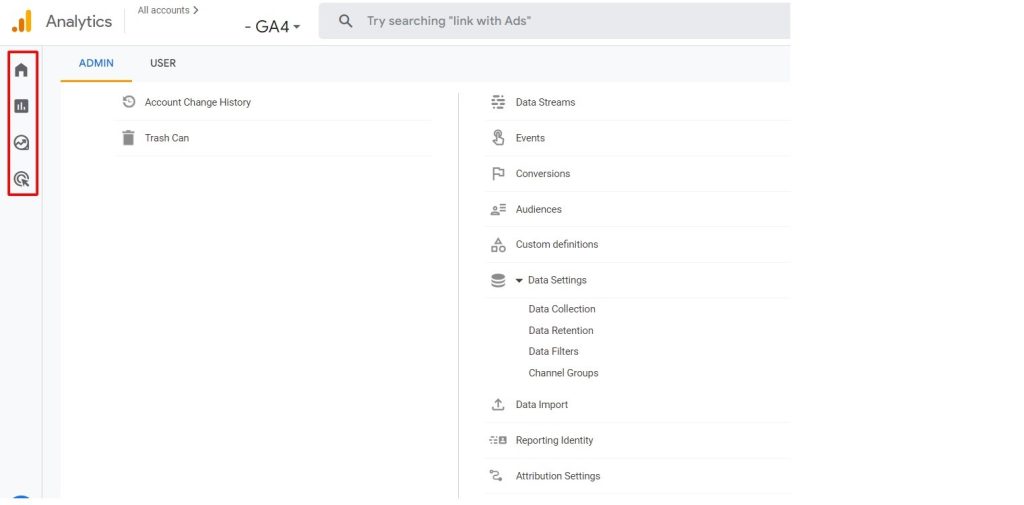
The GA4 Admin Panel
GA4’s admin settings go beyond the standard account adjustments. The control panel empowers users to configure data streams, sources, filters, tagging specifics, and advanced features. A unique “debug” mode allows real-time data and filter observation. Plus, the control panel extends to encompass in-depth developer tools, catering to advanced configurations.
Four Pillars of GA4 Reporting
GA4’s Four Distinct Sections:
Reports: The initial column houses icons that segment the interface into four sections: Reports, Explore, Advertising, and Configure. Each section starts with a snapshot page, offering an overview.
Explore: This area serves as an advanced arena for customised reporting and intricate data visualizations.
Advertising: Here, you dive into profound insights concerning conversion performance and user journeys.
Configure: In this space, you can manage custom events and dimensions
These sections collaboratively provide a comprehensive view of the user journey, refined data analytics, deeper advertising insights, and precise event and dimension management.
Lifecycle Insights through Reports
The realm of reports unveils vital campaign and user activity insights. Dive into acquisition, engagement, monetization, and retention reports for a detailed view.
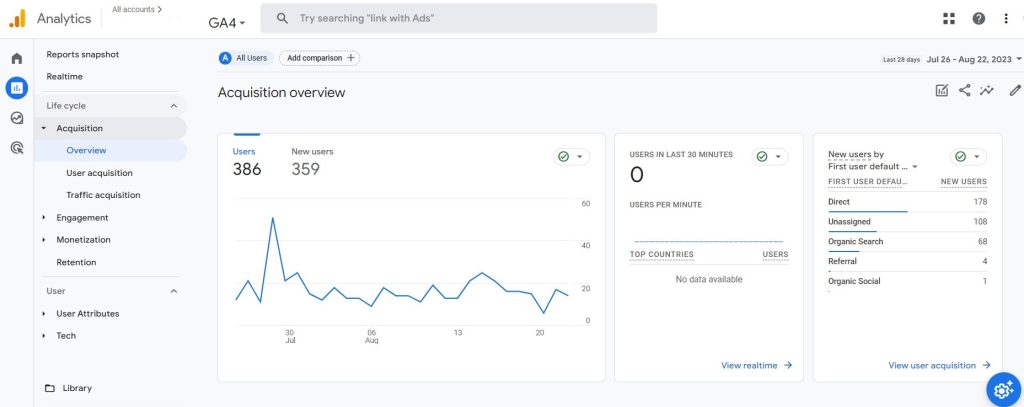
Acquisition Insights:
The acquisition summary screen offers a glimpse into diverse acquisition reports. This report delves into how users arrive at your site and the channels they utilize. It encompasses data on existing and new users, recent users, user mediums, session types, and lifetime value. Each summary report provides the pathway for detailed analysis through drill-downs and comprehensive investigations.
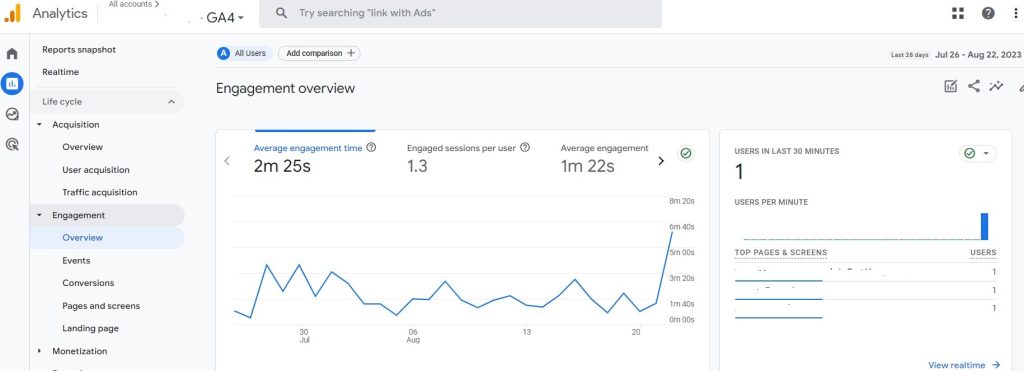
Engagement Insights:
The engagement reports shed light on user interactions within your site or app. The overview screen features reports on crucial aspects such as engagement time, engaged sessions per user, and time per session. It illustrates user activity trends, page views, and the pages they explore. Moreover, it gauges user “stickiness,” a measure of user return frequency.
Monetization Insights:
The monetization section provides a window into how your site or app generates revenue, be it through purchases or advertising. This segment unveils data encompassing total revenue, purchaser count, first-time purchasers, average revenue per user, prominent purchases by item, item views, coupon utilization, and ad unit statistics.
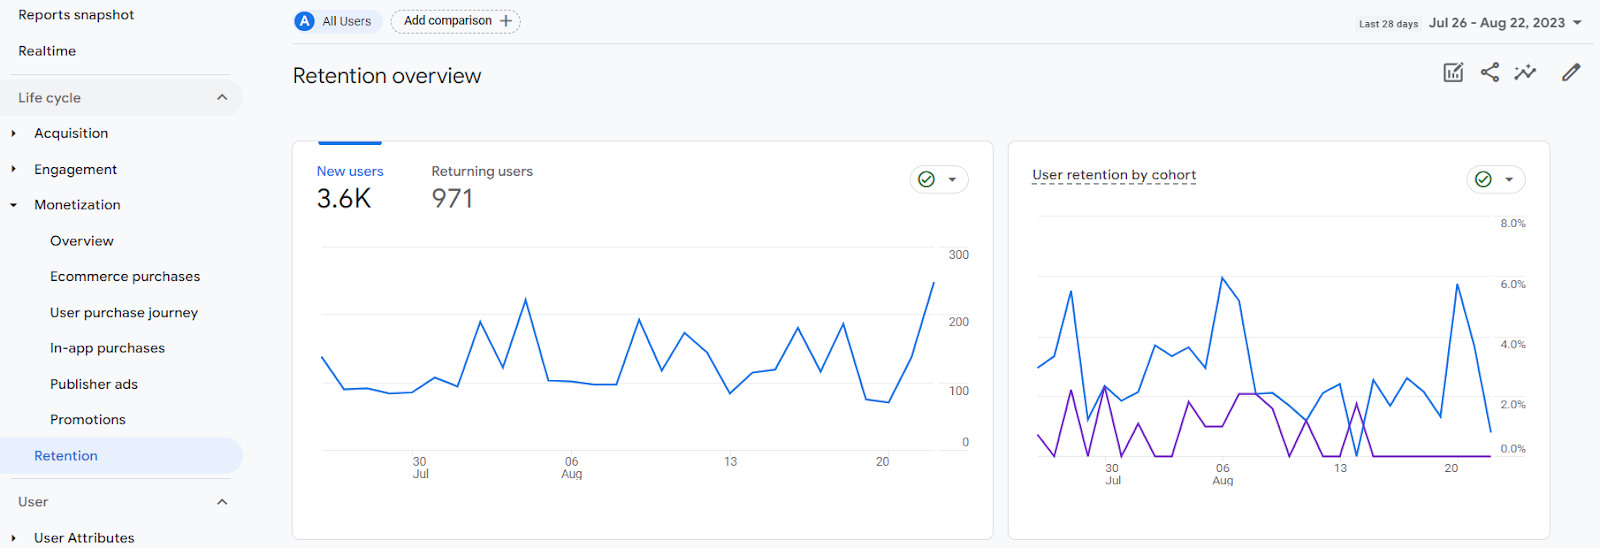
Retention Analysis:
The retention report offers a snapshot of customer return rates. It contrasts new users against returning users and presents retention rates. The report measures the duration of engagement during their return, tracks retention trends over time, and evaluates lifetime value.
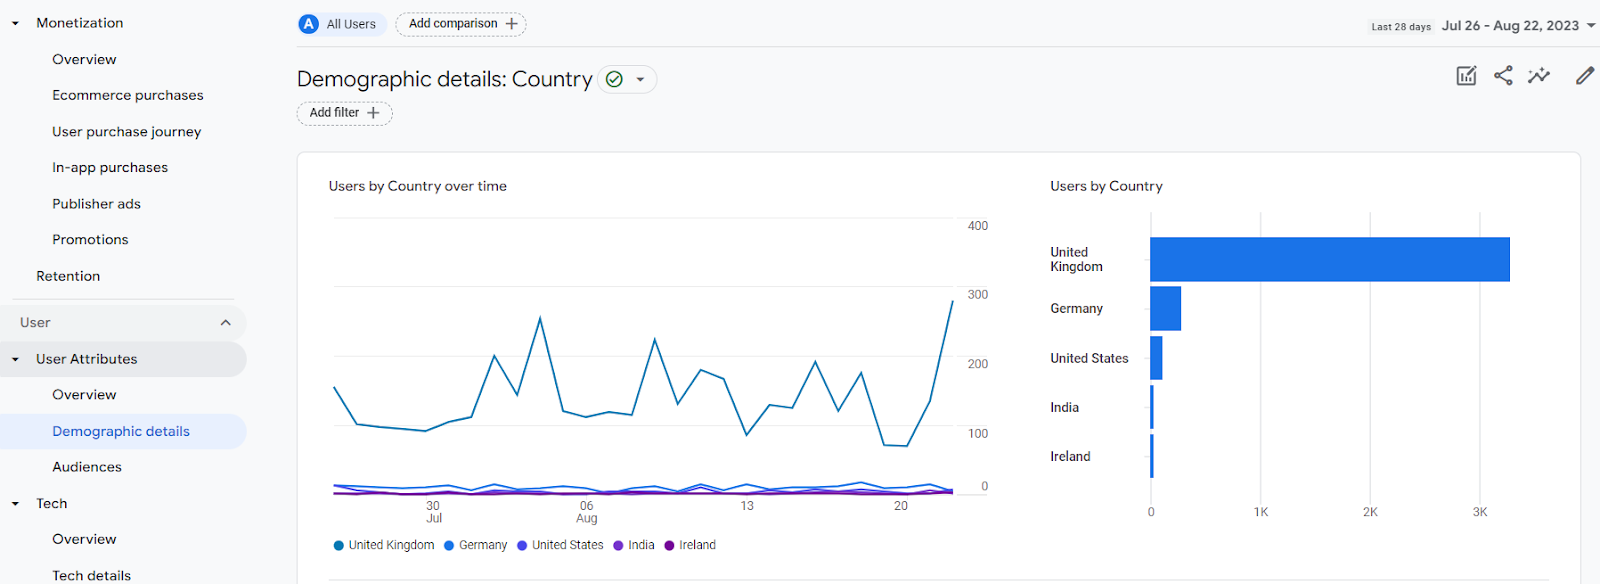
Insights into User Data:
User reports present pivotal details about individuals who visit or engage with your site or app. The summary screen hosts reports on crucial user demographics, encompassing user distribution by country, city, gender, interests, age, and language. Google compiles this information using diverse methodologies. While some metrics stem from concrete data like user browser language settings, others rely on advanced AI, contextual cues, and past behavior for accurate estimations. Each report can be organized according to various user categories.
Understanding Events:
Events showcase the various actions users take on your site, like clicking, adding items to a cart, or changing account info. These actions, smaller in scale, can be customized as needed. By comparing event data to other events or past data, you can see how things are changing over time, whether in a good or not-so-good way.
Key Insights to Remember:
- GA4 is the latest Google Analytics version.
- Move to GA4 before then to avoid data loss.
- GA4 uses event-based tracking, unlike UA’s session and page-based approach.
- GA4 has fewer pre-made reports, but it’s highly customizable.
- Regular feature updates are expected in GA4.
- Data sampling and API thresholds can impact GA4. BigQuery export offers in-depth reporting.
- If you need assistance with GA4 integration, our expert team is here to help.
Last Line:
To sum it up, Google Analytics 4 (GA4) is a significant upgrade from Universal Analytics. It’s all about tracking user actions, customizing reports, and understanding your audience better. As GA4 replaces Universal Analytics, it’s wise to switch over to make the most of its benefits. The sooner you move, the more you’ll adapt to its features and ensure data continuity. GA4 is like a new tool that can help you make smarter marketing choices based on real insights. It’s a step forward in the world of digital analytics, and embracing it will keep you ahead in the game.


© 2023 Blazon All Rights Reserved.

Leave a Reply
You must be logged in to post a comment.